Create a new Report - Report Tutorial
In the ReportTool, creating a new report requires a series of procedures. These procedures are summarized in the following section, “Overview,” and then detailed in the sections that follow.
Overview
Step 1: Define the report, determining if a similar report exists that you can modify or if you must create a new report
Step 2: Create a blank report
Step 3: Add a title to the report
Step 4: Add style to text on the report Step 5: Add the run date to the report Step 6: Specify the data source
Step 7: Add and sort fields on the report
Step 1: Defining the Report
Before beginning, make a list of what the report must accomplish and what infor- mation must appear on the final printed report. Then, compare your list to the pre- loaded report list to determine if a similar report already exists (see Tables B.1 through B.14 in “Appendix B: Preloaded Reports” beginning on page B-1). It is faster to modify an existing report than to create a new one.
NOTE: When you modify a preloaded report, always save the report under a dif- ferent name. This will preserve your new report when reports are updated.
Step 2: Creating a Blank Report
To create a new report:
1. Verify that your server (or ZServer module) is running.
2. On the File menu, click New. This displays the Open dialog box containing a list of available reports.
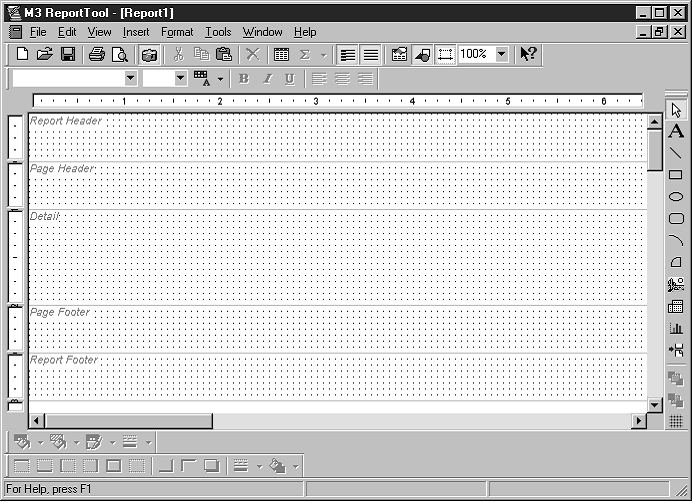
3. Select Blank Report, then click OK. The layout for a blank report is dis- played in Figure 7.5.
FIGURE 7.5
The report layout is divided into five sections:
• Report Header – Appears at the top of page one of the report. It is not repeated on subsequent report pages.
• Page Header – Appears at the top of every page. On page one, it appears below the Report Header.
• Detail – Encompasses the body of the report.
• Page Footer – Appears at the end of every page. On the last page, it appears above the Report Footer.
• Report Footer – Appears at the end of the last page.
Step 3: Adding the Report Title
The report title appears in the Report Header section. To create a title for the report:
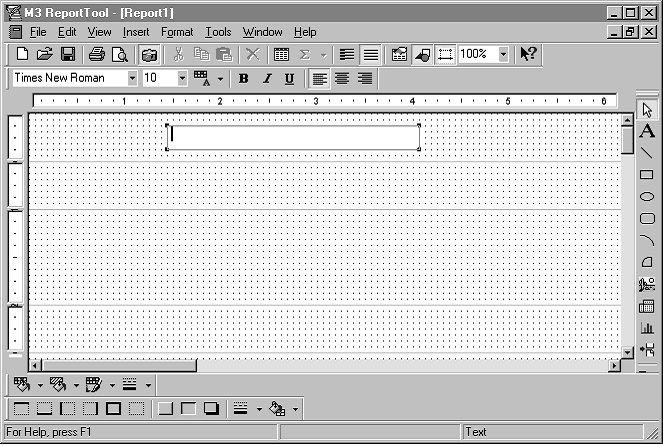
1. On the Drawing toolbar, click the A symbol.
2. In the Report Header (shown in Figure 7.5), drag the mouse to create a text box (shown in Figure 7.6).
FIGURE 7.6
3. In the text box, type the title of your report. When finished, click outside the text box to deselect it.
Step 4: Formatting Text
To modify the text properties of the report title, or any text added to the report:
1. Verify the text box is not selected. To do so, click elsewhere on the report.
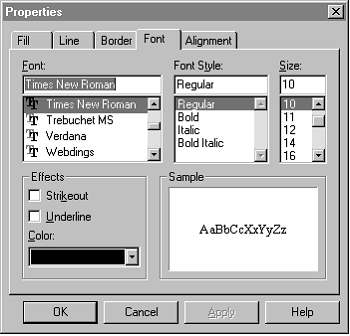
2. Right-click in the text box you want to format, then select Properties from the menu. This displays the Properties dialog box (Figure 7.7).
A. To change the font, click the Font tab (shown in Figure 7.7). Select the desired font, font style, and size.
FIGURE 7.7
B. To change the alignment, click the Alignment tab. Select left, center, or right alignment, then click OK.
3. To resize the text box, select the text box, then drag one of the corners.
4. To move the text box, click outside the text box to deselect it. Then click on the text box and drag it to the new location.
5. To center a text box or field on a report, click Align on the Format menu.
This displays the Align dialog box. In the Horizontal group, click Center, and then click OK.
6. On the File menu, click Print Preview to view your changes. Click Close to exit the Print Preview and return to the report.
7. When finished, click Save on the File menu.
Step 5: Adding the Report Run Date
To display the date the report was run in the Report Header:
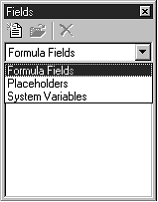
1. On the Insert menu, click Fields. This displays the Fields window
(Figure 7.8).
FIGURE 7.8
2. In the list, select System Variables. This displays a list with the following:
• PRINTDATE – prints the current date
• PRINTTIME – prints the current time
• PAGE – prints the current page number
• TOTALPAGES – prints the total number of pages
• REPORTNAME – prints the report file name
3. Drag PRINTDATE into the Report Header section, then close the Fields window.
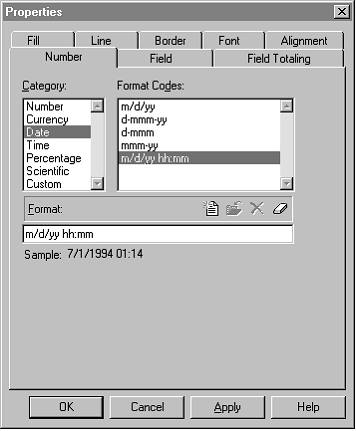
4. Right-click in the new date field, then select Properties. This displays the Properties dialog box (Figure 7.4).
A. Click the Field tab, then click Date.
B. Click the Number tab (shown in Figure 7.9). In the Category box, select Date. In the Format Codes box, select a format.
FIGURE 7.9
C. Make any desired text property changes in the Font and Alignment tabs. (For instructions, see “Step 4: Formatting Text.”) Then click OK.
5. To move or resize the new date box, see steps 3 and 4 beginning on page 7-8 for instructions.
6. On the File menu, click Print Preview.
7. Today's date should be visible on your report. If part of the date is trun- cated, click Close to return to the report layout, and then resize the date box.
8. When finished, click Save on the File menu.
Step 6: Specifying the Data Source
To specify the database table from which the report will draw data:
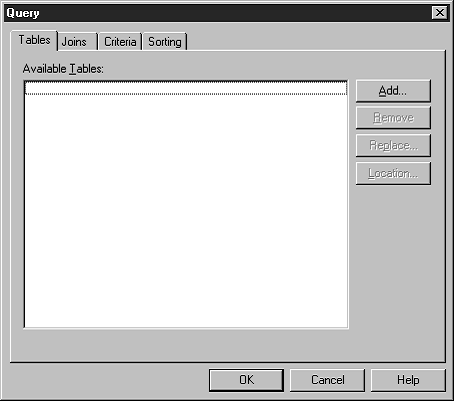
1. On the Tools menu, click Query. This displays the Query dialog box.
FIGURE 7.10
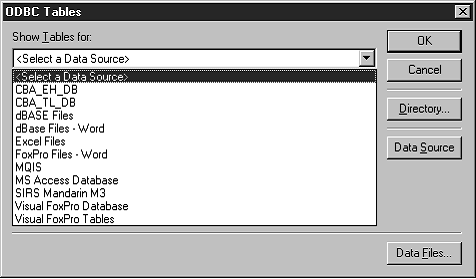
2. On the Tables tab, click Add. This displays the ODBC Tables dialog box (Figure 7.11).
FIGURE 7.11
Note: ODBC stands for "Open DataBase Connectivity," a standard by which many commercial database vendors have agreed to abide. ReportTool offers you the choice of using other ODBC- compliant database systems; however, if you choose another system, Mandarin technical support will not be able to help you in case of a problem. Mandarin only guarantees ReportTool will work with the M3 system.
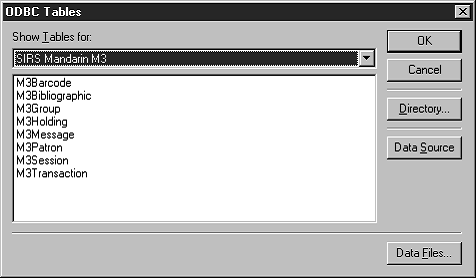
3. In the Show Tables for list, select SIRS Mandarin M3. If your library offers multiple database types, the Mandarin M3 ODBC dialog box (Figure 7.3) appears. Select the appropriate database type (usually Library), then click OK. This displays the ODBC Tables dialog box (Figure 7.12) with M3 data- base table choices listed.
FIGURE 7.12
4. Select the database table you want to use. Your default options are:
• M3Barcode – contains the barcodes used by Circulation
• M3Bibliographic – contains all the MARC bibliographic records
• M3Group – contains all the item and patron groups
• M3Holding – contains all the MARC holding records
• M3Message – contains all the blocking messages used by Circulation
• M3Patron – contains the patron records
• M3Session – contains the session records created by Circulation
• M3Transaction – contains the transaction records created and used by Circulation
5. Click OK. This closes the ODBC Tables dialog box, and displays the data- base table name in the Tables tab of the Query dialog box.
6. Click Close to close the Query dialog box.
Step 7: Adding and Sorting Fields
Placing Fields onto the Report
To place fields from a database table onto a report:
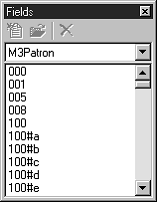
1. On the Insert menu, click Fields. This displays the Fields window (Figure 7.13).
FIGURE 7.13
2. The database table you selected in step 4 of “Step 6: Specifying the Data Source” displays. Below it appears a list of field tag numbers and sub-tag codes that represents all the defined fields in a record. In Figure 7.13, an M3 patron record is defined. (For a definition of the fields listed here, see “Obtaining Record Definitions” on page 7-15.)
3. Drag the desired fields from the Fields window into the Detail section of the report you are creating.
NOTE: If you need to enlarge the Detail section, position your cursor over the ruler bar where the bottom margin of the Detail section intersects the ruler bar. When the cursor changes to a double-ended arrow, drag the margin line down to resize.
4. When finished, close the Fields window.
5. To change the text properties and field placement, see “Step 4: Formatting
Text” beginning on page 7-8.
6. When finished, click Save on the File menu.
Sorting Field Data
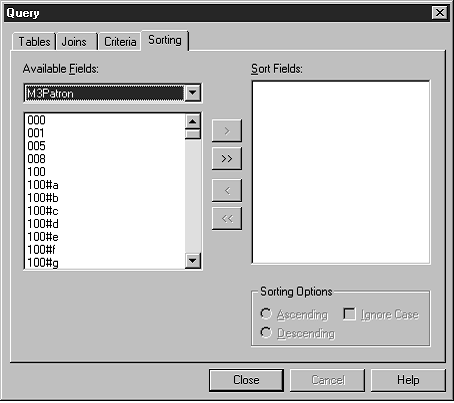
To sort the data in a report by a field:
1. On the Tools menu, click Query. This displays the Query dialog box
(Figure 7.10).
2. Click the Sorting tab (shown in Figure 7.14). In the Available Fields list, select a database table.
FIGURE 7.14
You can use this dialog box at any time to add, remove, or reorder data sort formulas.
3. Select a field in the left column, then click the > button to move the field to the Sort Fields box.
4. Select the field in the Sort Fields box. In the Sorting Options group, click Ascending or Descending, and then select the Ignore Case check box.
5. Repeat steps 3 and 4 for each field you want to sort. The fields will be sorted in the order they appear in the Sort Fields box; you can reorder the fields by dragging the field to the appropriate position in the Sort Fields box. When finished, click OK.
6. On the File menu, click Print Preview. Data should now display in the order you selected.
7. When finished, click Save on the File menu.