To open the Mandarin M3 Server Monitor window in your Web browser:
1. On the taskbar, click the M3 Server icon (shown in Figure 9.1).
FIGURE 9.1
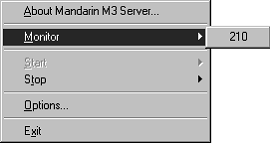
2. This displays the M3 Server menu (Figure 9.2). Select Monitor, then click the port number you want to display. For this example, 210 will be used.
FIGURE 9.2
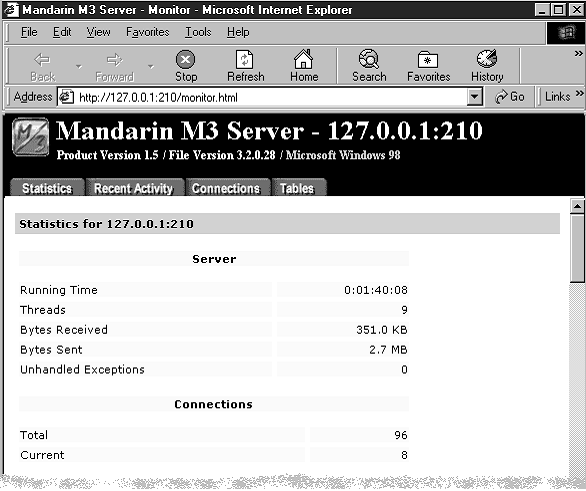
3. This displays the Login dialog box. Type your user ID in the Login Name box, your password in the Password box, and then click OK. This displays the Monitor window (Figure 9.3).
FIGURE 9.3
• M3 Server header – Displays the IP address and port number being viewed, as well as the M3 Server version number and the current oper- ating system.
• Selection tabs – Use the four tabs to move between Statistics, Recent Activity, Connections, and Tables.
• Resource Information pane – Displays information related to the selected tab.
Statistics Tab
This tab (Figure 9.3) displays information related to the selected server, such as port details, usage statistics, and recent activity. All information described will not immediately display; use the scroll bar to navigate through the window.
• Server (shown in Figure 9.3) – The technical statistics on system perfor- mance for the port.
• Running Time – The amount of time M3 Server has been listening to the port.
• Threads – The number of resources dedicated to client requests.
• Bytes Received – The number of bytes of information received by the port.
• Bytes Sent – The number of bytes of information the M3 Server has sent to the clients.
• Unhandled Exceptions – The number of unanticipated error conditions that have been encountered with the M3 Server. On occasion, the M3
Server may shut down in an attempt to fix itself.
• Connections (shown in Figure 9.3) – The statistical data on connections through the port.
• Total – The number of connections that occurred on the port.
• Current – The number of connections that are currently active.
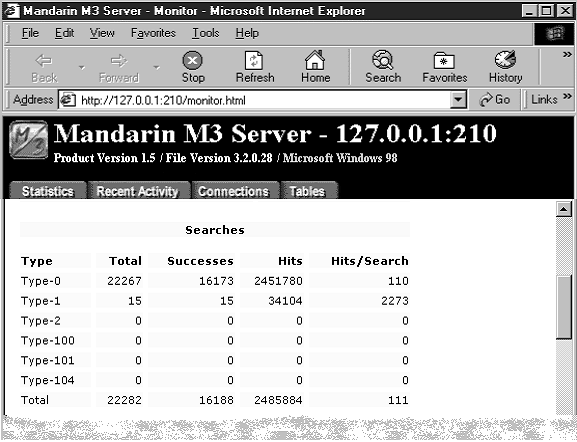
FIGURE 9.4
Tip: Use the scroll bar to navigate through the window.
Note: The M3 Server recog- nizes the client searches as Type-0, Type-1, or Type-101
• Searches (shown in Figure 9.4) – The number of searches that occurred through the port.
• Type – The Z39.50 search type category. The M3 Clients report statis- tics through Type-0, Type-1, and Type-101 searches.
• Successes – The number of successful searches performed through the port.
• Hits – The number of successful hits or matches for the search.
• Hits/Search – The average number of hits or matches in each search performed through the port.
FIGURE 9.5
• Presents (shown in Figure 9.5) – The number of records the M3 Server pro- vided in response to the client requests.
• Records – The number of records presented by the M3 Server.
• Requests – The number of requests received for records.
• Records/Request – The average number of records per request that occurred through the port.
• Scans (shown in Figure 9.5) – The number of whole field index scan requests and processes performed.
• Requests – The number of scan requests received.
• Terms – The number of entries returned.
• Terms/Request – The average number of entries returned per request.
FIGURE 9.6
• Sorts (shown in Figure 9.6) – The number of sorts requested and the number of records sorted.
• Requests – The number of sorts requested.
• Records – The number of records sorted.
• Records/Request – The average number of records sorted per request.
• Updates (shown in Figure 9.6) – The number of new, modified, and purged records. The total number of requests and failures for each Update Type is listed.
• Insert – The number of new records added.
• Replace – The number of edited records.
• Delete – The number of records that have been removed or purged.
• Total – The total number of updates that have occurred.
FIGURE 9.7
Tip: To refresh the pane, click Refresh on your browser.
• Response Time (milliseconds) (shown in Figure 9.7) – The response time for each activity performed by the M3 Server reported in milliseconds.
• Activity – The response time for each M3 Server action is monitored and reported in milliseconds.
• Minimum – The minimum response time for the action.
• Maximum – The maximum response time for the action.
• Average – The average response time for the action.
Recent Activity Tab
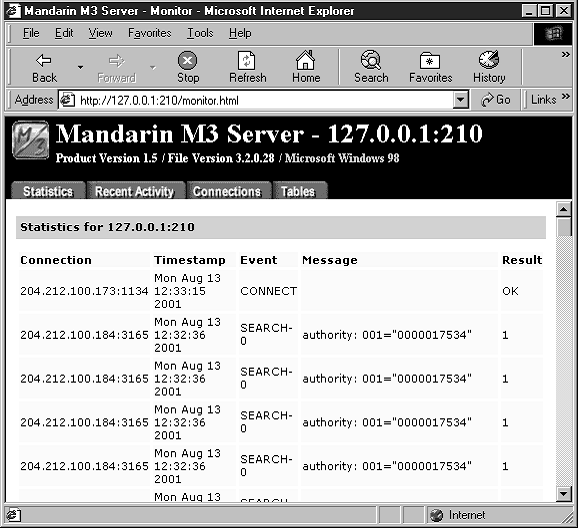
This tab (Figure 9.8) displays recent activity for the selected port, including the sites that connected, the connection date and time, the event performed, any mes- sages, and the result. The Resource Information pane can display up to 1,024 lines of activity. All activity is written to the log file.
FIGURE 9.8
• Connection – The TCP/IP address and port number of each client site that has recently connected.
• Timestamp – The date and time of each event.
• Event – The occurrence types.
• Connect – Occurs when a client connects to a port.
• Search – Occurs when a client completes a search on a port. Search lists the database search, along with the Z39.50 query in the Message column. It also displays the number of matching records or an error number in the Result column.
• Disconnect – Occurs when a client disconnects from a port.
• Message – Additional information regarding the event.
• Result – The result for the event, if any.
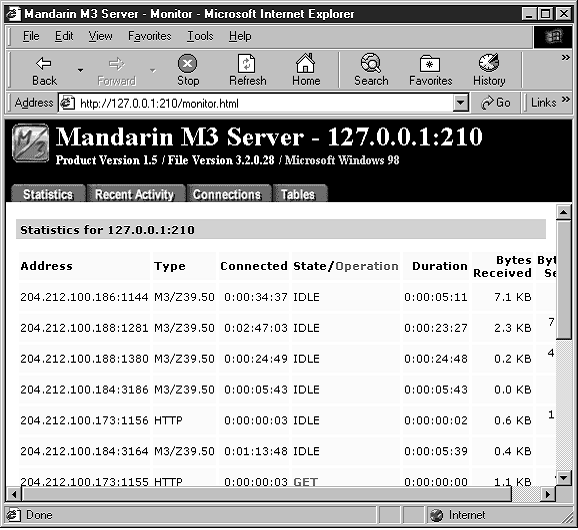
Connections Tab
This tab (Figure 9.9) displays the current connections to the server.
FIGURE 9.9
• Address – The TCP/IP address and port number of each client site that is currently connected.
• Type – The type of connection made.
• Connected – The length of time the connection has been open.
• State – The status of the connection. States include (but are not limited to) Idle, Processing, Delivery, and Closing.
• Operation – The operation currently in process by the M3 Server for this connection. Operations include (but are not limited to) Initialize, Search, Present, Sort, and Scan.
• Duration – The length of time the connection has been in the current State or Operation.
• Bytes Received – The number of bytes of information received through this connection.
• Bytes Sent – The number of bytes of information the M3 Server has sent to this connection.
Tables Tab
This tab (Figure 9.10) displays a list of the tables being used by the M3 system.
FIGURE 9.10